How popularity scores can give you insights about products with high potential
When you use the popularity scores add-on, you can easily see which articles in your assortment have high potential. In this article, we'll explain to you how you can do this!
1. Connect Google Analytics to Omnia
First of all, you need to connect the Google Analytics API to Omnia. Here you can read a manual on how to do this. After setting this up, the field # of UPV PDP last 4 weeks can be used in Omnia.
2. Create a report in Omnia
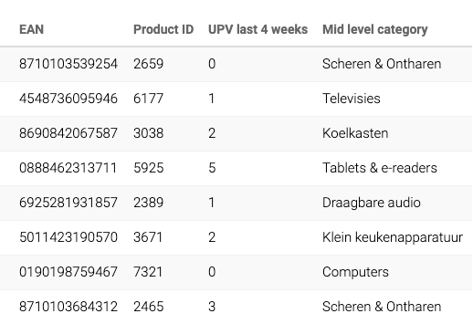
In Omnia, you can create a report, where at least the following fields should be added:
- EAN
- Product ID
- [# of UPV PDP last 4 weeks]
- Top level category
- Mid level category
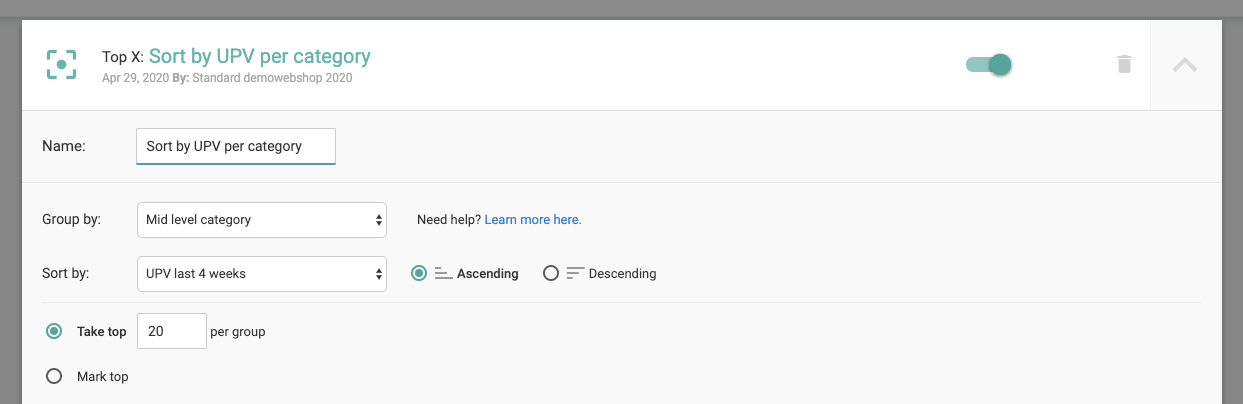
Using the Top X functionality, you can then select a part of your assortment (e.g. articles with lowest amount of UPV per mid level category) that shows the products that do not have a lot of pageviews.
3. Sort Pricewatch export file
Based on the popularity column, you can sort the list of articles in Excel. Additionally, you can choose to only view articles with a high popularity score by filtering in Excel. These two steps ensure that you get a list of articles that are popular.
4. Compare popularity list with Omnia report
Using some basic Excel logic (e.g. VLOOKUP) you can check whether articles from the Omnia report are also present in the list with popular articles. If that is the case, this means that the articles are popular in the market, but don't have a lot of pageviews on your productpage. For these articles, a price change might be relevant!