The performance screen is an overview of the aggregated results of your company and can be viewed per shop in Omnia.
The performance screen can be found in the menu of your Omnia portal on the left under the ‘Performance’ tab.
The performance screen is an overview of the aggregated results of your company and can be viewed per shop in Omnia. This screen can be used to monitor the performance of your business in terms of revenue, sales, marketing/traffic, pricing, and assortment. Performance results can be viewed per shop and adjusted to a customized time range.
Measuring and monitoring your performance screen is important as this gives you proper insights in your commercial results in combination with your current strategy. You can detect and act upon inefficiencies while also assessing priorities. An important aspect of the performance screen is to map all different variables together in the graph to understand how they impact each other. For example, if you see the price ratio drop, does your revenue and conversion rate increase?
The information you can plot in the performance overview depends on the information you imported and have mapped in Omnia. More information about mapping import fields can be found in this article.
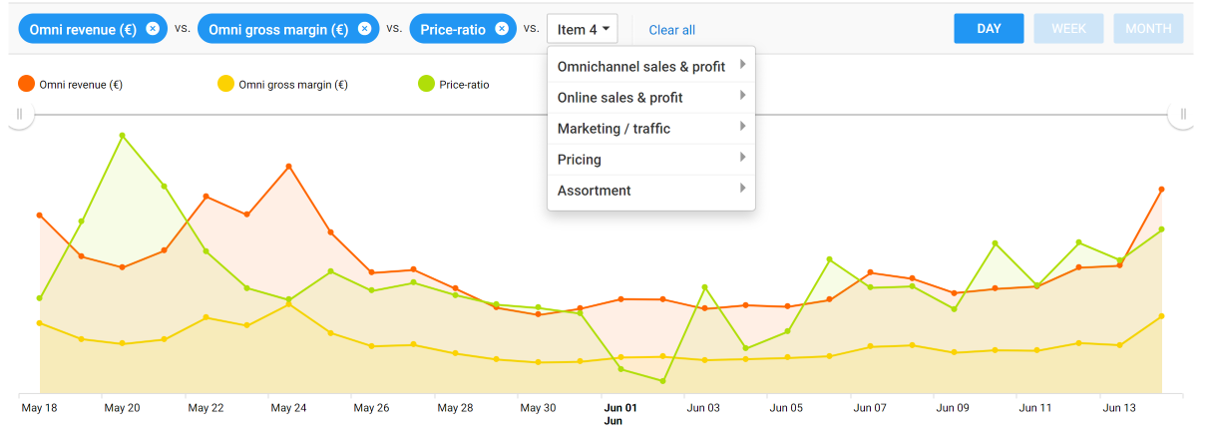
You can customize the performance screen and decide which performance results you want to see. The following items can be viewed in the performance screen:
- Omnichannel Sales & Profit
Revenue – view your revenue as an absolute value.
Gross Margin – view your net sales revenue minus cost of goods sold
Gross Margin incl. supplier conditions – includes the supplier conditions as well
Contribution margin – the revenue minus all variable costs
Number of units sold – view the number of units sold per shop
- Online Sales & Profit
Revenue – view your revenue as an absolute value.
Gross Margin – view your net sales revenue minus cost of goods sold
Gross Margin incl. supplier conditions – includes the supplier conditions as well
Contribution margin – the revenue minus all variable costs
Number of units sold – view the number of units sold per shop
- Marketing / Traffic
Unique pageviews Product Detail Page
Paid clicks – the number of paid clicks
Marketing spend – the amount spent on marketing
e-CPC –cost per clicks
ROAS – return on Ad Spend - Pricing
Price-ratio – compare your prices/price-ratio to market average
Omni-channel conversion rate (%) – how many people proceed from visit to buy
Online conversion rate (%) – how many people proceed from visit to buy - Assortment
Number of imported products
The performance screen and graph can viewed on different aggregation levels that fit your needs. You decide whether you want to view the visuals per day, week, or month and you can select and filter upon all category and brand levels.
The following paragraph states a customized performance screen in which you can monitor your omnichannel revenues and omnichannel gross margins together with your online revenue and online gross margins. This gives a useful overview of the division of online versus offline revenues as part of your total revenues and could help in prioritizing business strategies.
Above performance items can be viewed per dimension. In this way you can monitor your performance per category, brand of marketing channel. The dimensions that can be selected are:
- Top-Level Category
- Mid-Level Category
- Low-Level Category
- Brand
- Marketing Channel
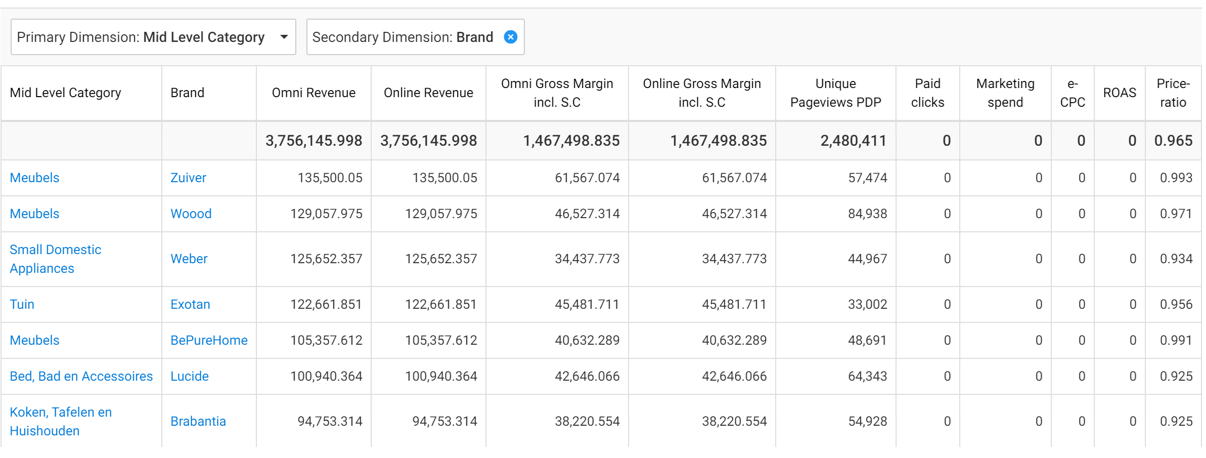
Therefore, you will be able to analyze performance per category and per brand, like the example above. The variables can be filtered from high to low or reversed.